
Purpose
Use the assigned dashboard and performance-metric views to review operational activity, compare results with targets, and identify high-priority, overdue, unassigned, or otherwise exception-based work that may require follow-up.
Roles
This test case may be executed by:
Facility Manager
Building Operations Administrator
Before you begin
Confirm that your user profile has access to the applicable executive or facility-management dashboard.
Know the workgroup, location, service area, or performance period you need to review.
Allow the dashboard charts to finish loading before interpreting the results.
Remember that the available charts, task counts, and metric values reflect your access and the current environment data.
Review the Dashboard
Step 1: Open and refresh the dashboard
1. Login to the IBM Tririga homepage: https://frs-qa.usgov.tririga.com/
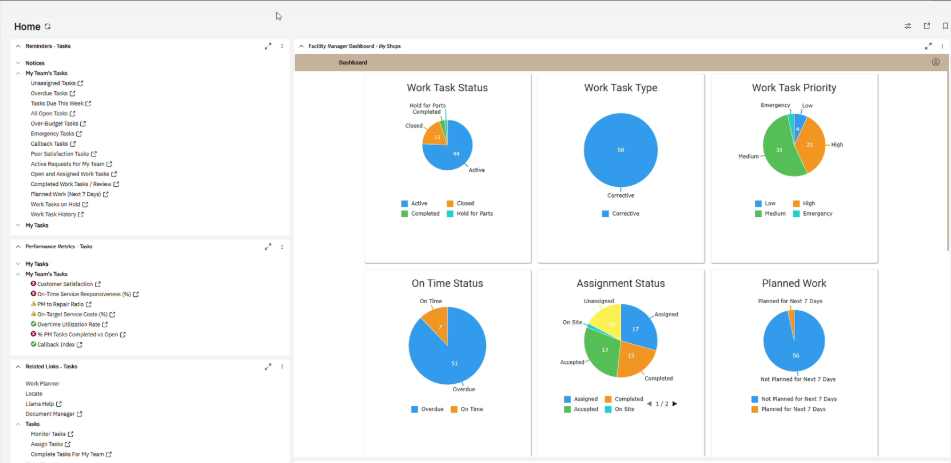
2. Open Home. The dashboard assigned to your role appears in the main workspace.
3. When the dashboard does not display current values, select the refresh icon beside Home.
4. Wait for all charts and lists to finish loading.
5. Confirm that the dashboard title and scope match the operational area you intend to review.
Step 2: Review the dashboard indicators
1. Review Work Task Status to compare active, completed, closed, and hold-related work.
2. Review Work Task Type to understand the composition of the current workload.
3. Review Work Task Priority for low, medium, high, and emergency work.
4. Review On Time Status to identify on-time and overdue work.
5. Review Assignment Status to identify assigned, accepted, completed, on-site, or unassigned work.
6. Review Planned Work to determine whether upcoming tasks are planned within the displayed period.
7. Scroll below the summary charts to review additional charts and the detailed work-task list when available.
Expected result
The user can view the assigned dashboard, review high-level performance against targets, filter dashboard information to exception conditions, and identify the detailed work records that may require action.
Common mistakes to avoid
Interpreting dashboard values before all charts have finished loading.
Reviewing the wrong dashboard, workgroup, location, or organizational scope.
Assuming a red or yellow status icon explains the issue without comparing Results and Target.
Treating No data to display as a failed metric.
Forgetting that a selected chart segment filters the other dashboard components.
Leaving a filter active and assuming the reduced task count represents the full workload.